|
Based on data from 47 countries representing 80% of the world’s electricity generation, the following 2020 highlights are observed:1
· Renewable electricity generation kept growing at remarkable rate, while fossils, especially coal, and nuclear electricity production fell. · Among major economies, China rapidly recovered from the COVID-19 pandemic, and · Europe successfully integrated close to 45% of renewable energy in its electricity generation mix. |
|---|
Despite its overall negative impact on electricity consumption the COVID-19 pandemic did not stop renewable electricity progress during 2020. It may even have been a record year-over-year (YoY) increase for renewable energy, (RE, including bioenergy, geothermal, hydro, marine, solar and wind) with an increase of 419 terawatt-hours (TWh) globally (47 countries).2
In contrast, fossils (including coal, gas and oil) collapsed by 350 TWh globally (47 countries), probably by far the largest decline in the past 40 years (no data has been identified covering fossils electricity in periods prior to 1980).3 In comparison, in the aftermath of the financial crisis of the late 2000s – the event that had previously disrupted the most electricity generation from fossils until last year’s COVID-19 pandemic, the entire world’s electricity generation from fossils decreased by less than 200 TWh (2009-2008). In addition, for the first time since 2012-2011, global (47 countries) electricity generation from nuclear decreased – by 102 TWh.
It is also noteworthy that these changes have occurred in the midst of a slowdown in economic activity due to COVID-19 which has contributed to a small 19 TWh YoY decline in total global (47 countries) power generation. In other words, fossils and nuclear power suffered, not because of the pandemic, but because they lost out to solar and wind power, which offer the lowest cost options in most parts of the world.4
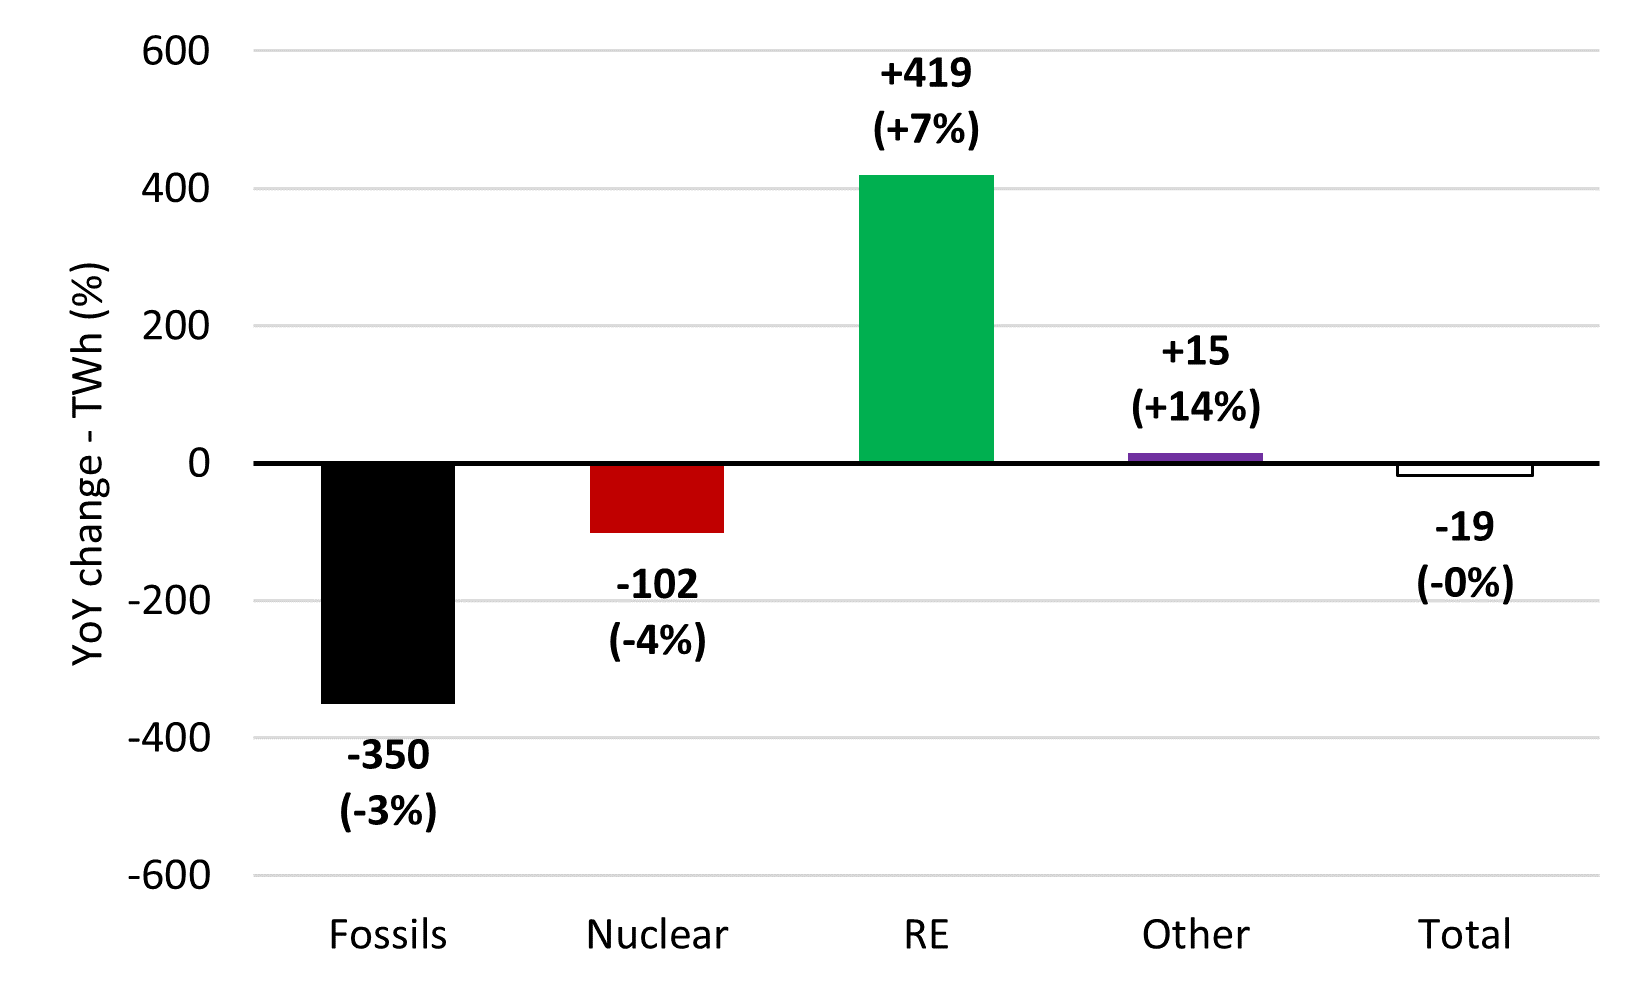
Source: International Energy Agency.
Among RE, wind increased the most (+167 TWh), followed by solar (+133 TWh) and hydro (+108 TWh). Among fossils, coal decreased the most – by far (-315 TWh).
Global Change in Electricity Generation Breakdown 2020-2019
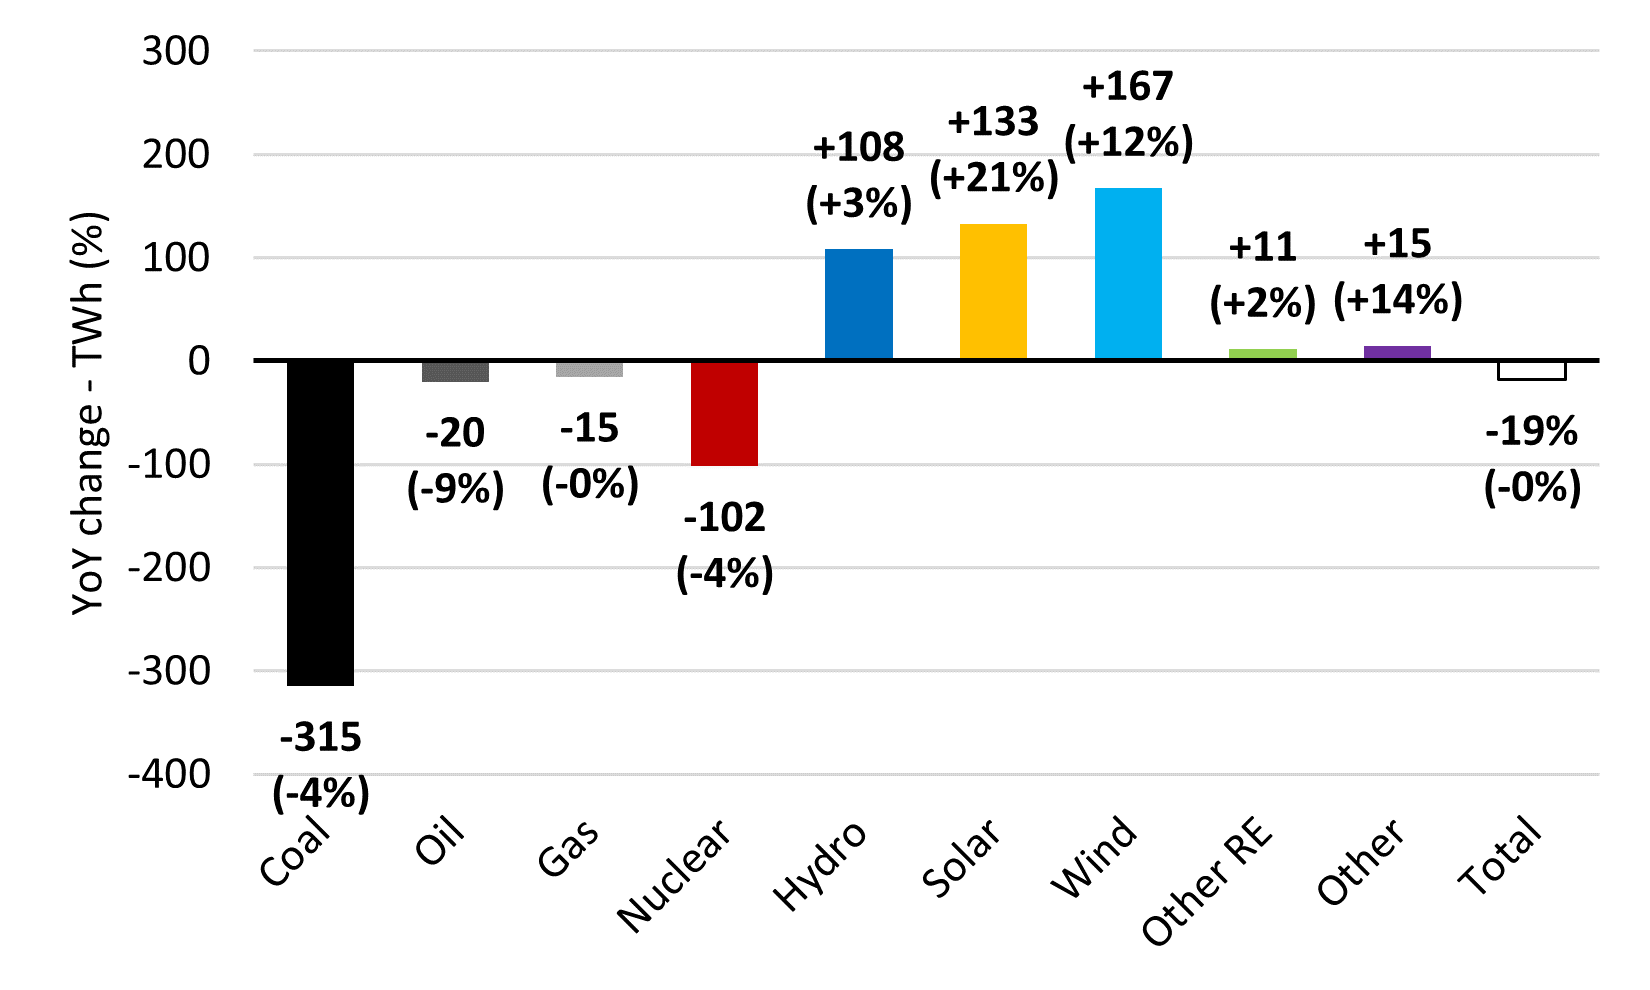
Source: International Energy Agency.
In the world’s largest economies in 2020, global trends have converged with the exception of China.
In China electricity generation from all types of technologies increased, especially from RE (+172 TWh, in particular, wind +64 TWh, hydro +61 TWh and solar + 45 TWh) and fossils (+123 TWh, essentially coal +117 TWh), resulting in a rather significant increase in total electricity generation (+313 TWh, or more than 4%).
Elsewhere (Europe, India, Japan and the United States (U.S.)) the story was the same: Decrease in total electricity generation accompanied by growth in RE displacing fossils and nuclear. The most remarkable growth occurred in Europe: +110 TWh, out of which wind contributed +50 TWh, hydro +31 TWh and solar +26 TWh. The decline in fossils was the biggest in the U.S.: -163 TWh, with a decrease in coal of almost 200 TWh, only partly compensated by an increase in gas +34 TWh. The largest decrease in nuclear power was observed in Europe: -88 TWh, half of which in France.
It may also be highlighted that coal faced difficulties in historical markets such as those of India (-59 TWh) and Europe (-104 TWh) where it was most notable, in Germany (-37 TWh). In Europe, pressures on coal did not only come from lower electricity demand and higher RE electricity output, but also from sustained carbon prices: about 25 euros per ton of carbon dioxide on average in 2020.5 Finally, electricity generation from nuclear fell again in Japan, as most existing reactors remained idled and some more reactors were temporarily shut down, having failed to install the required safety facilities (Sendai-1 & -2 and Takahama-3 & -4) for example.6
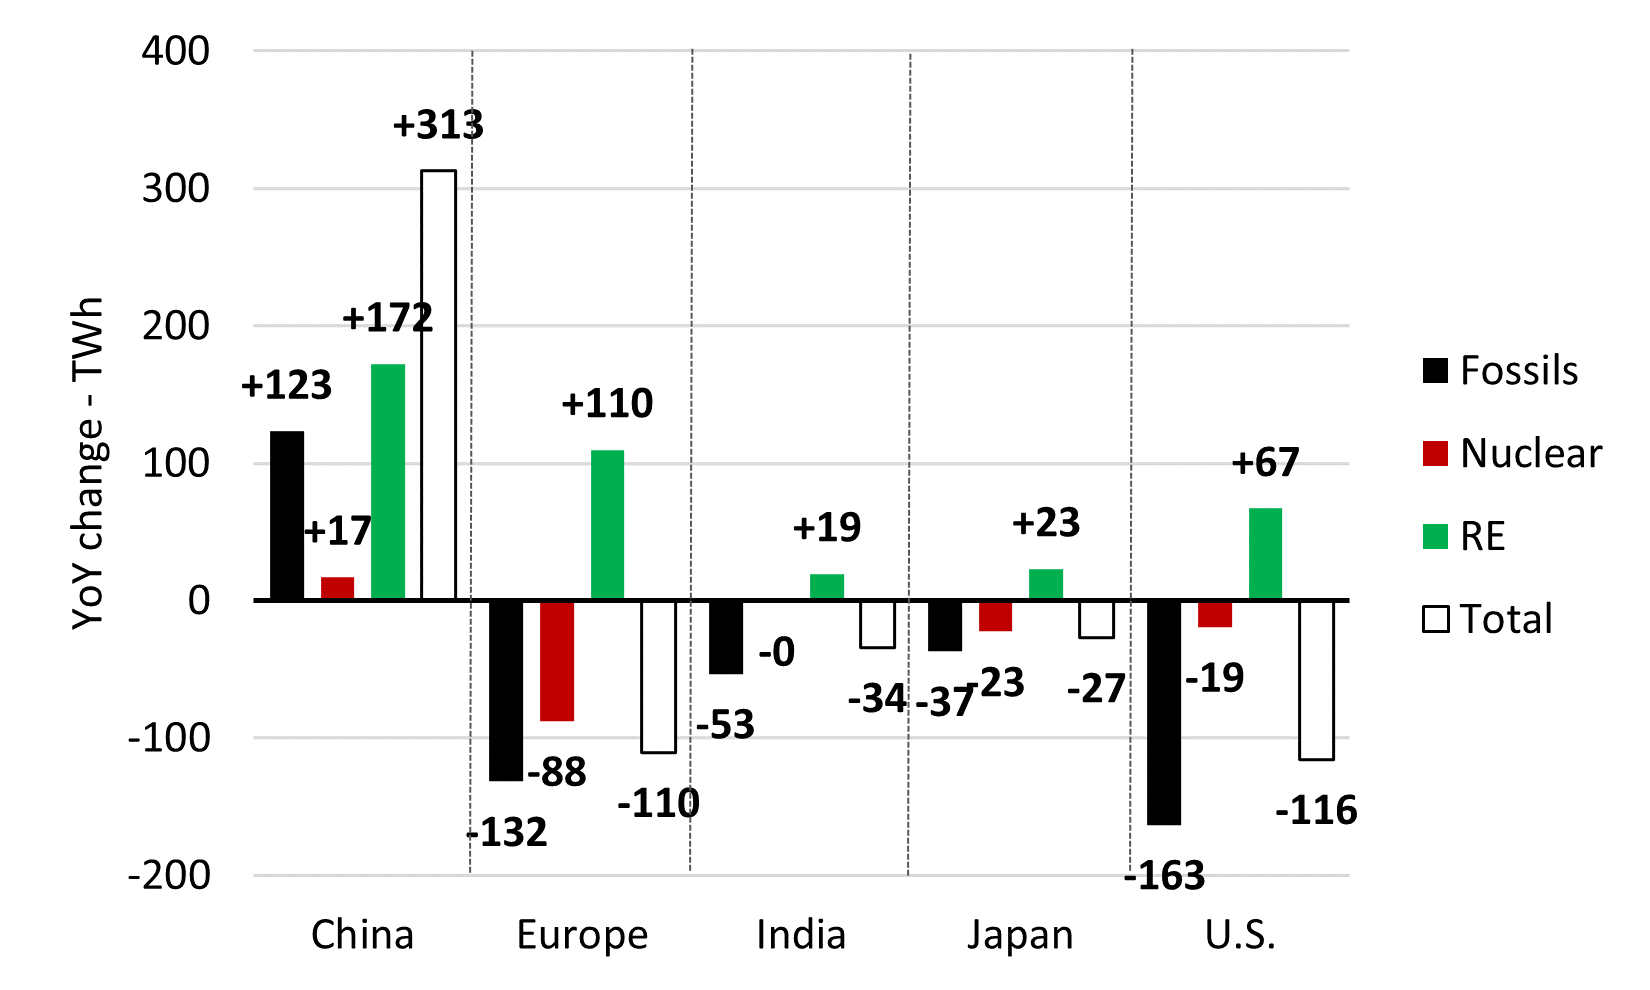
Source: International Energy Agency.
The share of RE in electricity generation increased everywhere. In 2020, RE reached an admirable 44% in Europe, a considerable 4-percentage point increase compared to 2019. Across the continent, the combined share of solar and wind rose to 19%. Following Europe, the share of RE in China got closer to 30%. At last, in India, Japan and the U.S. the share of RE was over 20% in 2020. Regarding the latter two, it may be noted that in Japan the end of the country’s fiscal year (FY) (April 1st – March 31st) 2030 RE target (22-24%) was almost reached – 10 years in advance (!), and that in the U.S. the share of RE overtook those of both coal and nuclear during 2020.
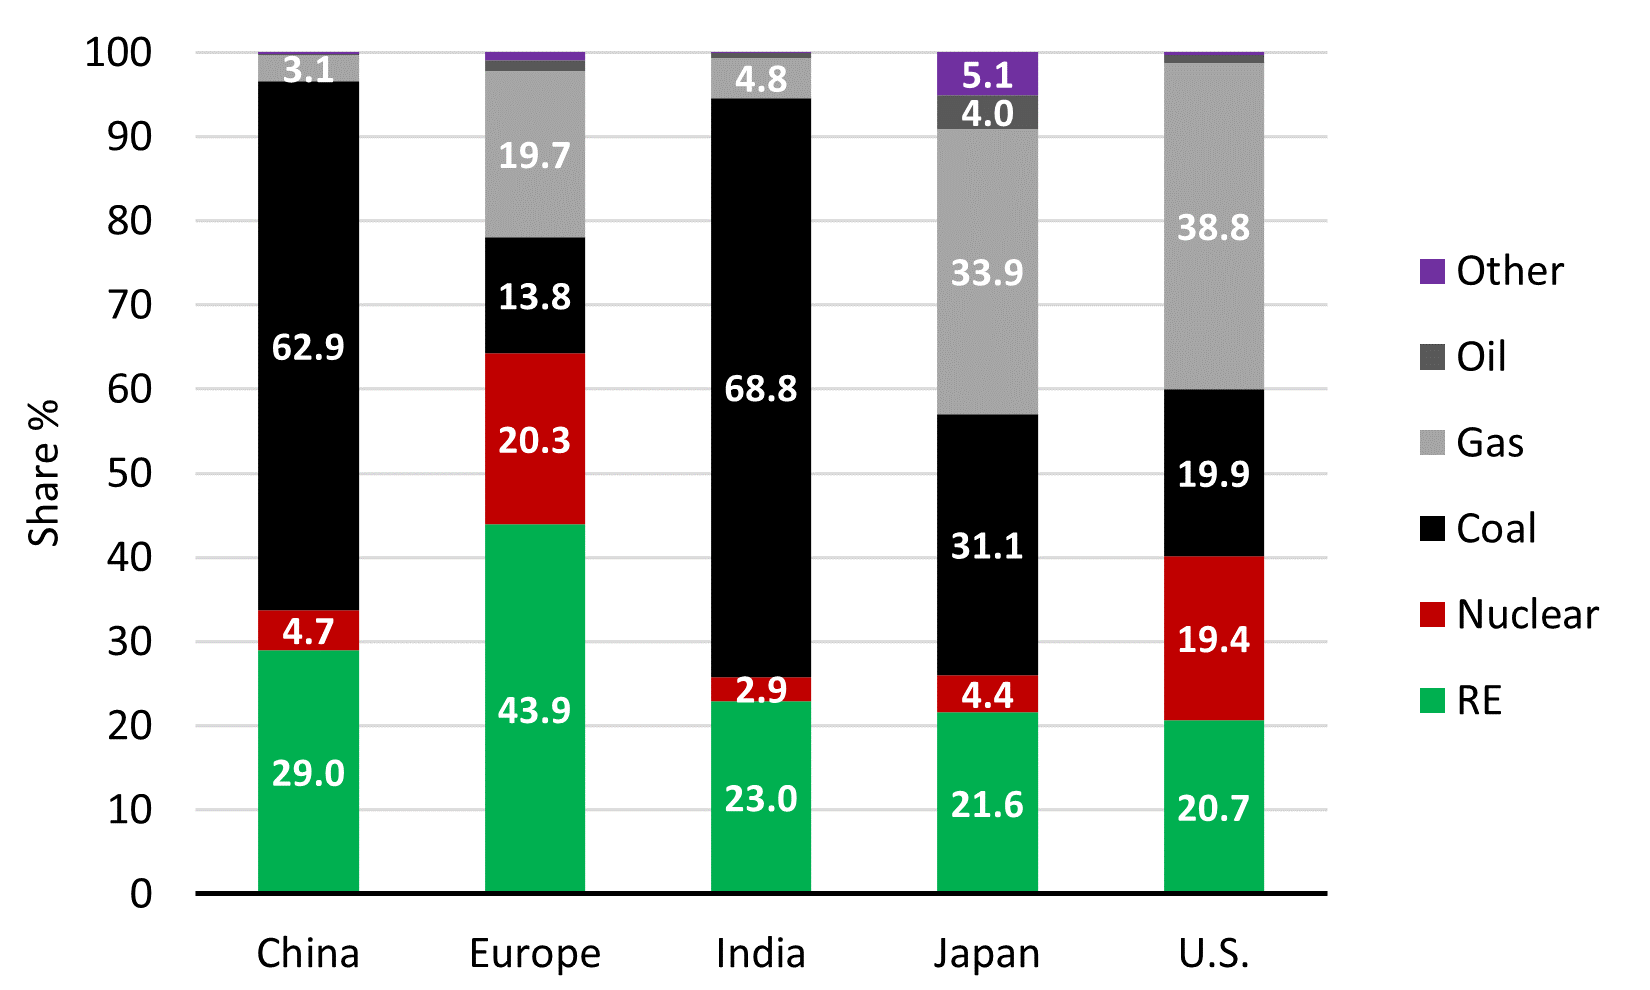
Source: International Energy Agency.
Continuing and accelerating RE progress will be critical to achieve 2050-2060 carbon neutrality objectives now shared by many countries worldwide (e.g., the U.S., China, many European countries, Japan…). For instance, European countries have long made RE central to their decarbonization efforts. As they reap the benefits from this strategy, the European Union (EU) – provisional agreement – and the United Kingdom (UK) both increased their 2030 greenhouse gas (GHG) emissions reduction targets in the past months. For the EU from 40% to 55% (compared to 1990), and for the UK from 57% to 68% (compared to 1990 as well).7 Once a laggard in terms of energy and climate plans, Japan is now also becoming more ambitious thanks to the success of RE. Indeed, having witnessed the rise of RE and the fall of nuclear since Fukushima Daiichi accident, the country has recently decided to increase its FY 2030 GHG emissions reduction target from 26% to 46% (compared to FY 2013). 8
- 1Unless otherwise note, all data are from the International Energy Agency, Monthly Electricity Statistics – April 2021 (downloaded April 19, 2021). This data covers 47 countries (including for examples: all OECD countries (except Israel), as well as China, India, and Brazil) in calendar year 2020, and is based on net generation – excluding electricity used in the production plant itself.
- 2BP, Statistical Review of World Energy 2020 (June 2020), covering the period 1965-2019 for gross electricity generation from RE, indicates that only once world’s electricity generation from RE increased by more than 400 TWh YoY (i.e., 403 TWh 2018-2017).
- The United States Energy Information Administration, International: Electricity (accessed April 23, 2021), covering the period 1980-2018 for net electricity generation from RE, indicates that only twice world’s electricity generation from RE increased by more than 400 TWh YoY (i.e., 412 TWh 2016-2015 and 431 TWh 2018-2017).
- 3BP, Statistical Review of World Energy 2020 (June 2020), covering the period 1985-2019 for gross electricity generation from fossils, indicates that the maximum YoY decrease in world’s electricity generation from fossils was 198 TWh in 2009-2008.
- The United States Energy Information Administration, International: Electricity (accessed April 23, 2021), covering the period 1980-2018 for net electricity generation from fossils, indicates that the maximum YoY decrease in world’s electricity generation from fossils was 173 TWh in 2009-2008.
- 4Bloomberg, J. Hodges, Wind, Solar Are Cheapest Power Source in Most Places, BNEF Says – October 19, 2020 (accessed April 26, 2021).
- 5Ember, Daily EU ETS Carbon Market Price (downloaded April 26, 2021).
- 6Japan Atomic Industrial Forum, Current Status of Nuclear Power Plants in Japan – April 6, 2021 (accessed April 26, 2021).
- 7For the European Union, European Commission, Commission Welcomes Provisional Agreement on the European Climate Law – April 21, 2021, and for the United Kingdom, UK Sets Ambitious New Climate Target ahead of UN Summit – December 3, 2020 (both accessed May 7, 2021).
- 8Ministry of Foreign Affairs of Japan, Prime Minister Suga’s Attendance at the Leaders Summit on Climate – April 22, 2021 (accessed May 7, 2021).